With the System Overview Editor, the installer draws a heat pump, buffer, or cooling setup. The customer sees every temperature and every valve live.
A schematic with live values replaces twenty calls a year about 'is my pump actually running?'.
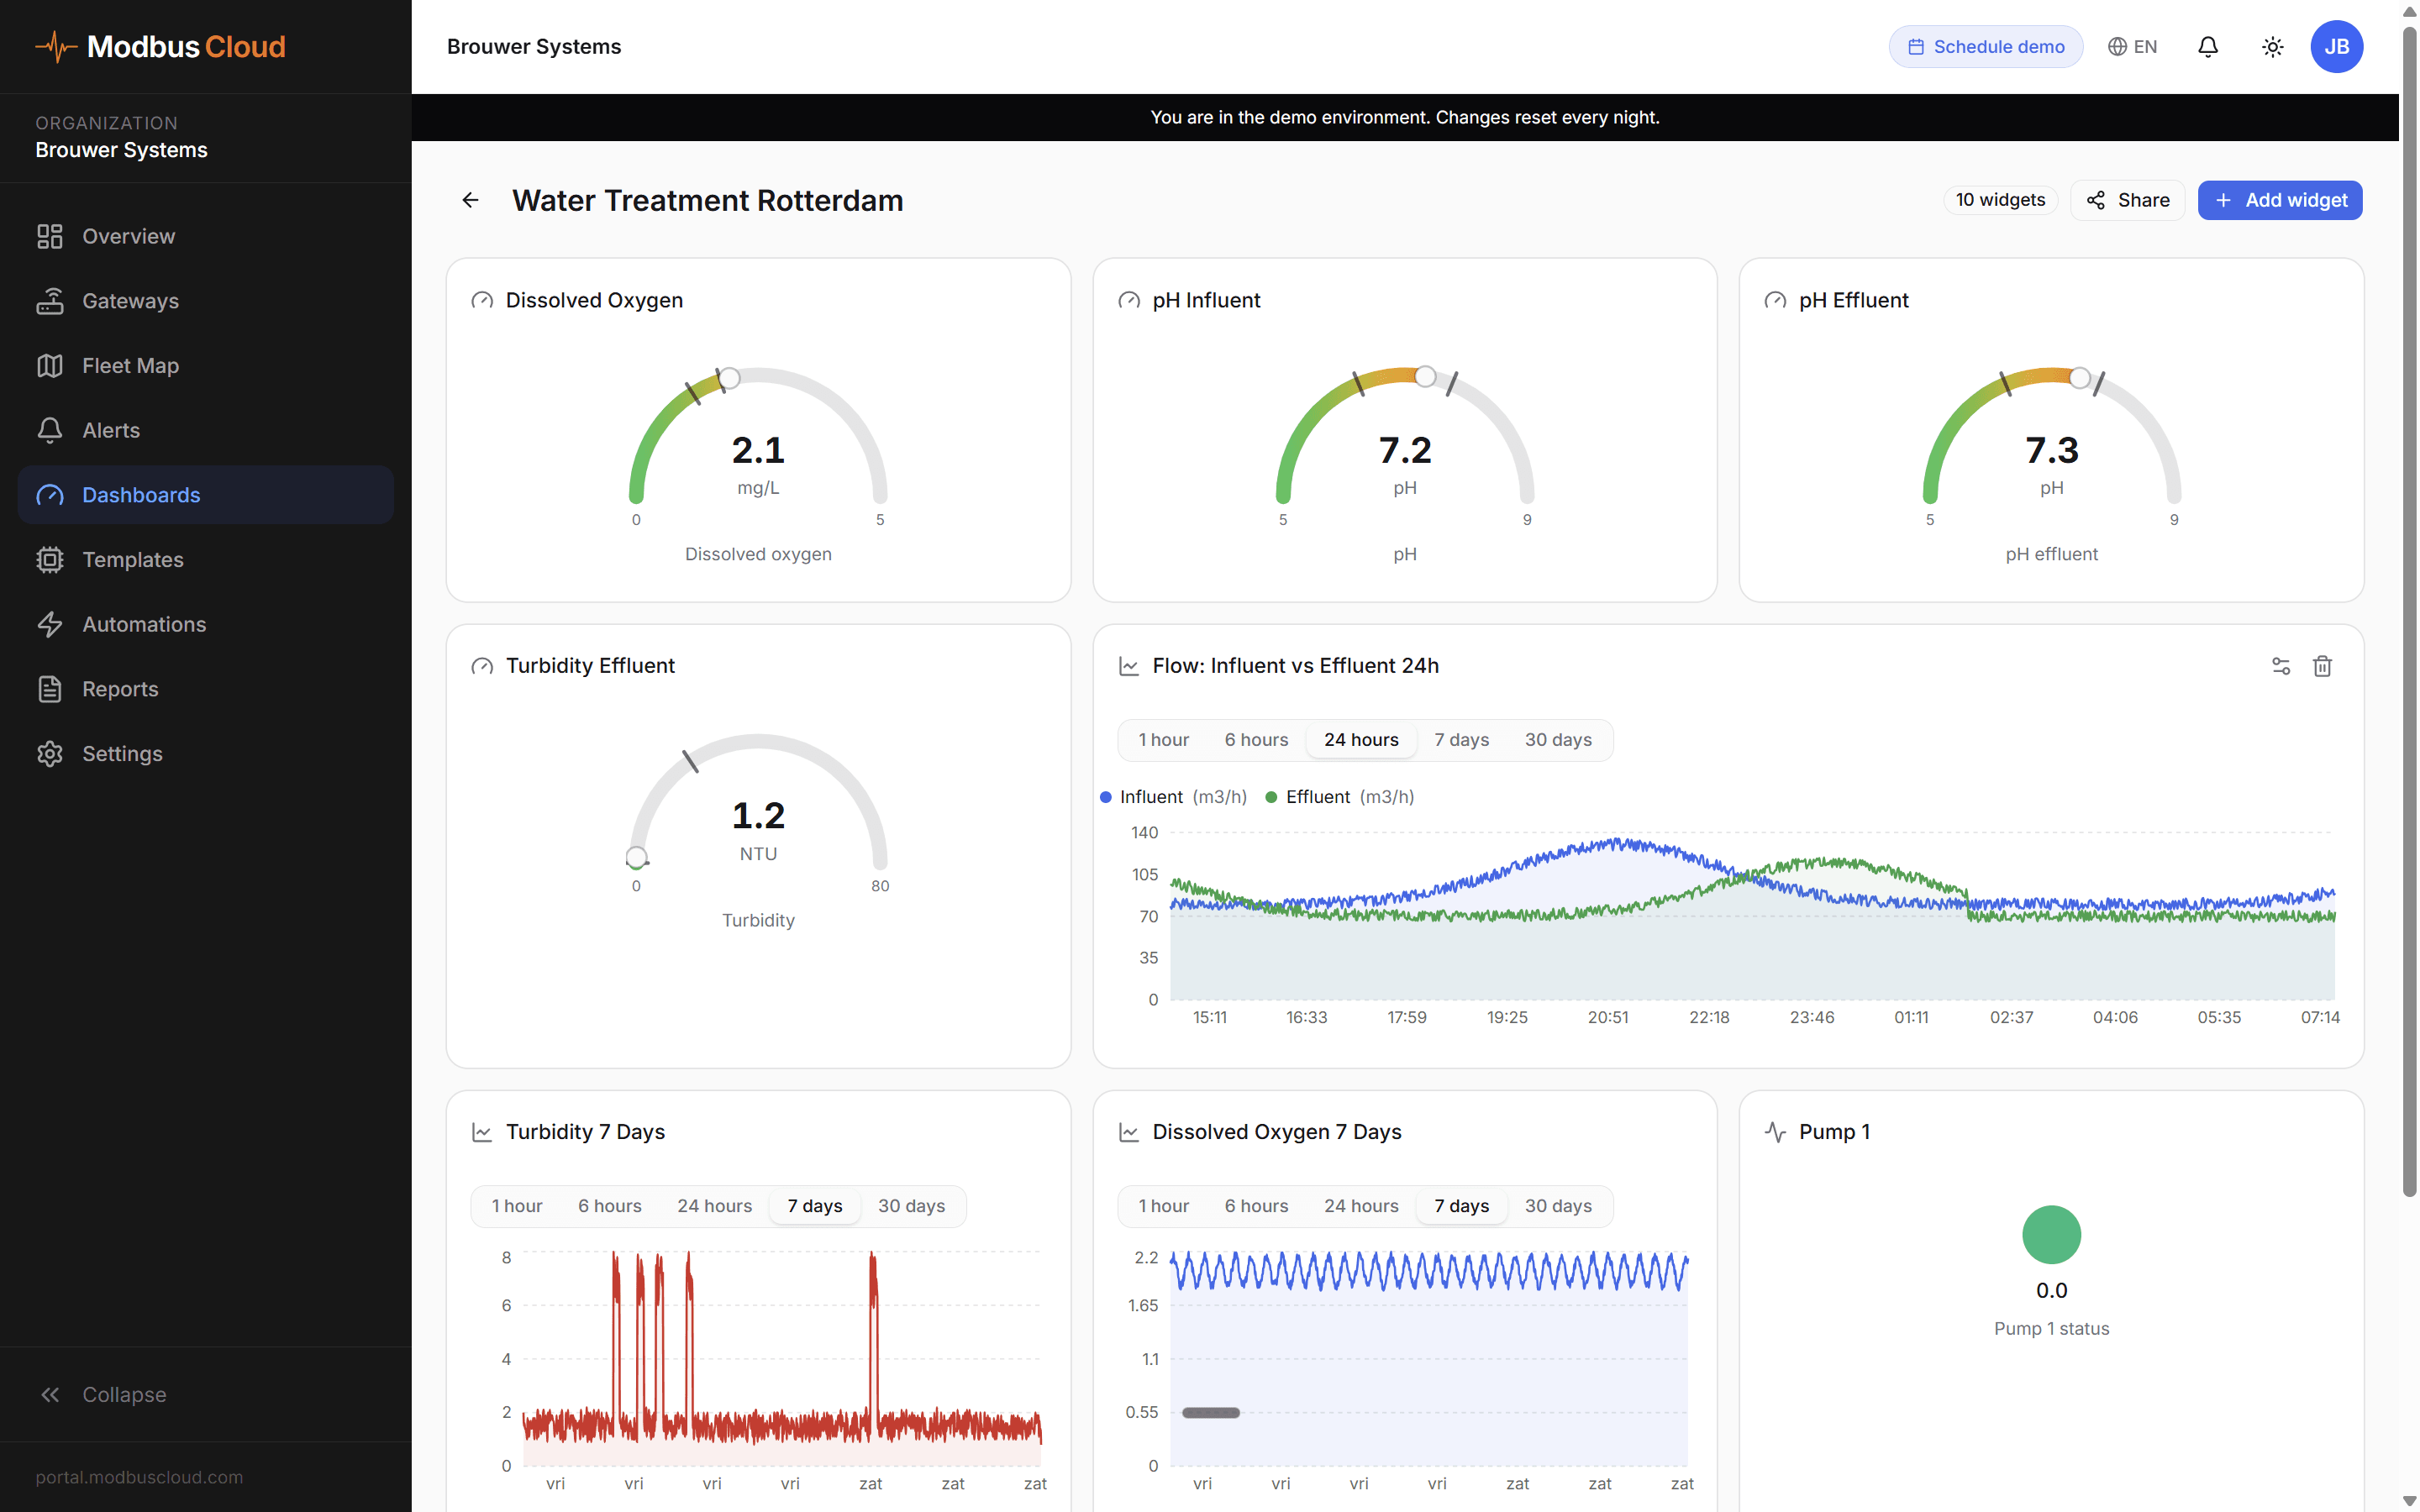
Dashboards combine readings with switches, sliders, and buttons. Within the bounds you set, the customer can adjust on their own.
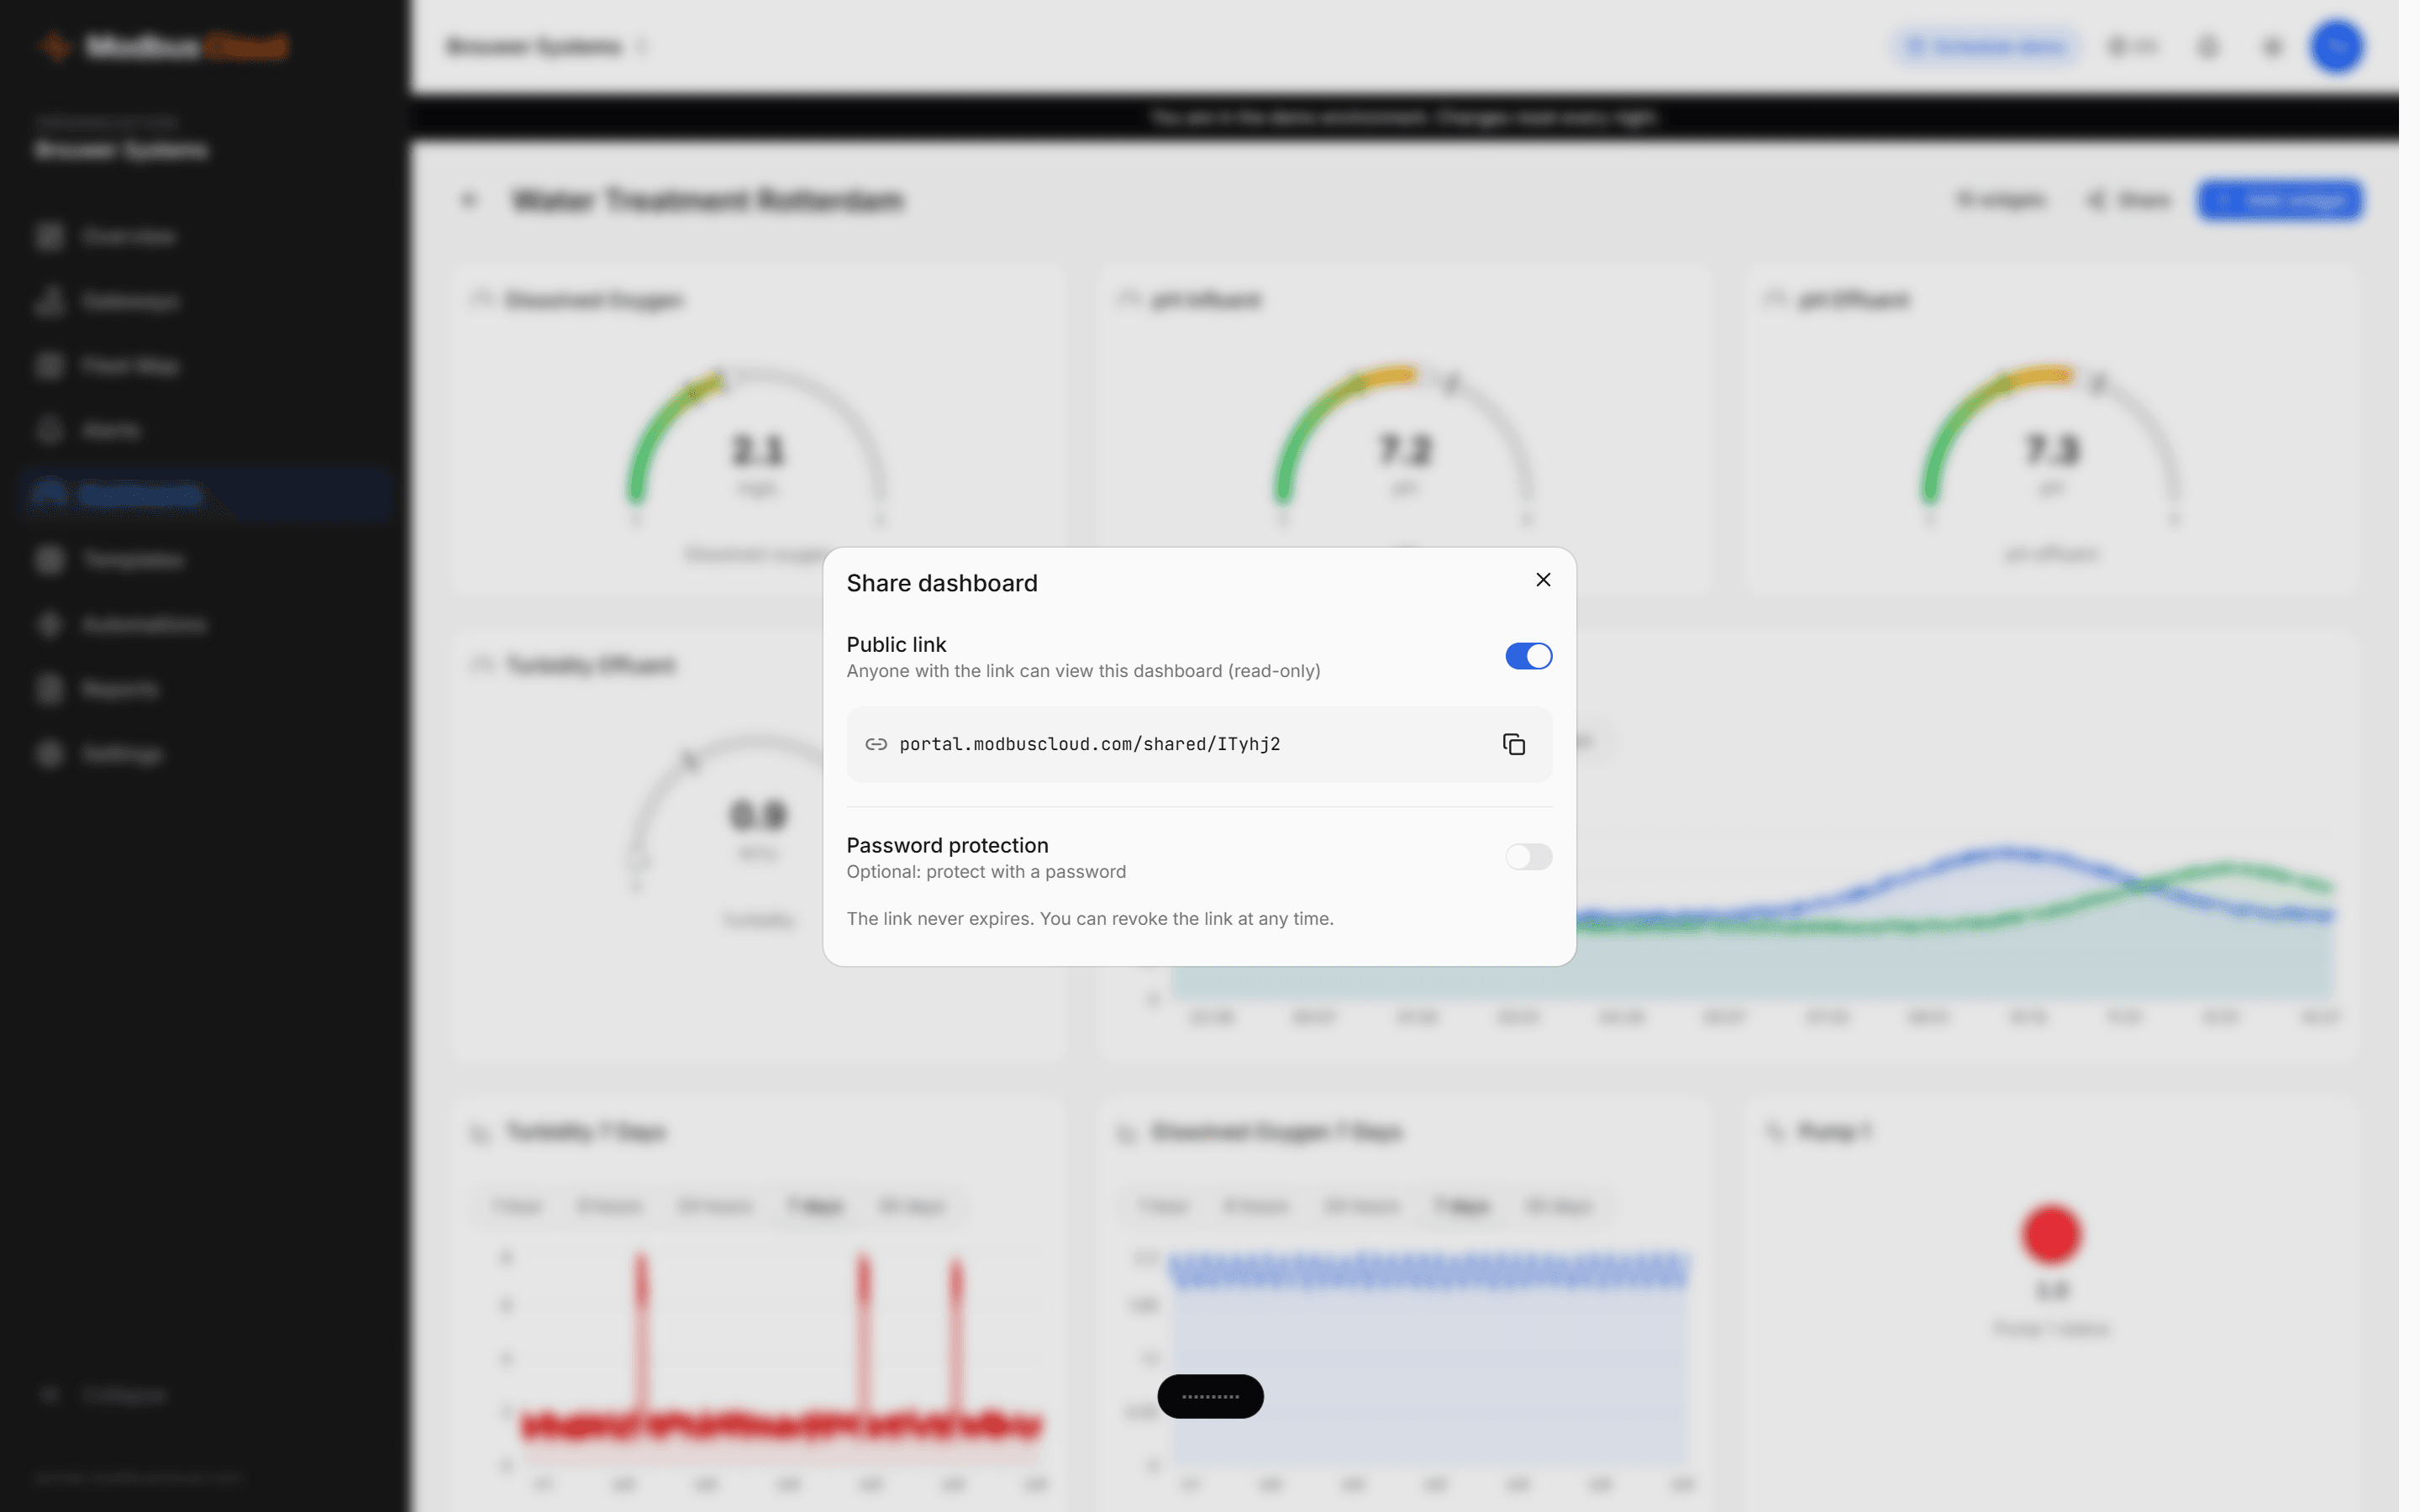
Every dashboard is shareable via a link, optionally password protected, revocable in one click. The end customer does not log in, the helpdesk simply watches along.
The System Overview Editor and the dashboard builder sit side by side, on the same grid, with the same data bindings.
Heat pump, buffer, boiler, floor heating, valves, pumps, meters. All from a library of prebuilt symbols.
Click a component, bind it to the right Modbus value. Temperature, status, position.
Add charts, metrics, or controls on the same screen. Twelve-column grid with drag and resize.
Generate a link, optionally password protected. Done.
Real-time data from our demo.
Industrial symbols, clean pipe routing, flow animation, and controls on the same canvas as your dashboards.
Heat pumps (mono and hybrid), buffers, boilers, radiators, floor heating, solar collectors, heat recovery, valves, pumps, meters, manometers, and more.
Nine pipe types, each with its own color. Flow is visible.
Pipes run orthogonally, no diagonal spaghetti. Automatic obstacle avoidance.
Fifty steps back, automatic save, no loss when a tab closes.
Gauges, line charts, bar charts, scatter, heatmap, thermometer, tank level, battery, tables, controls.
Shareable link without login, live data, ideal for customer displays or helpdesk screens.
Draw, connect, share in one portal
Live values on every component
Dashboards shareable with or without password
A schematic with live values is the fastest way to defuse a customer question before it is asked.