Build the report once, let the portal fill it every month. PDF, per customer, per period.
Every report is a template. Built last month for customer X? Next month it runs automatically with the right period.
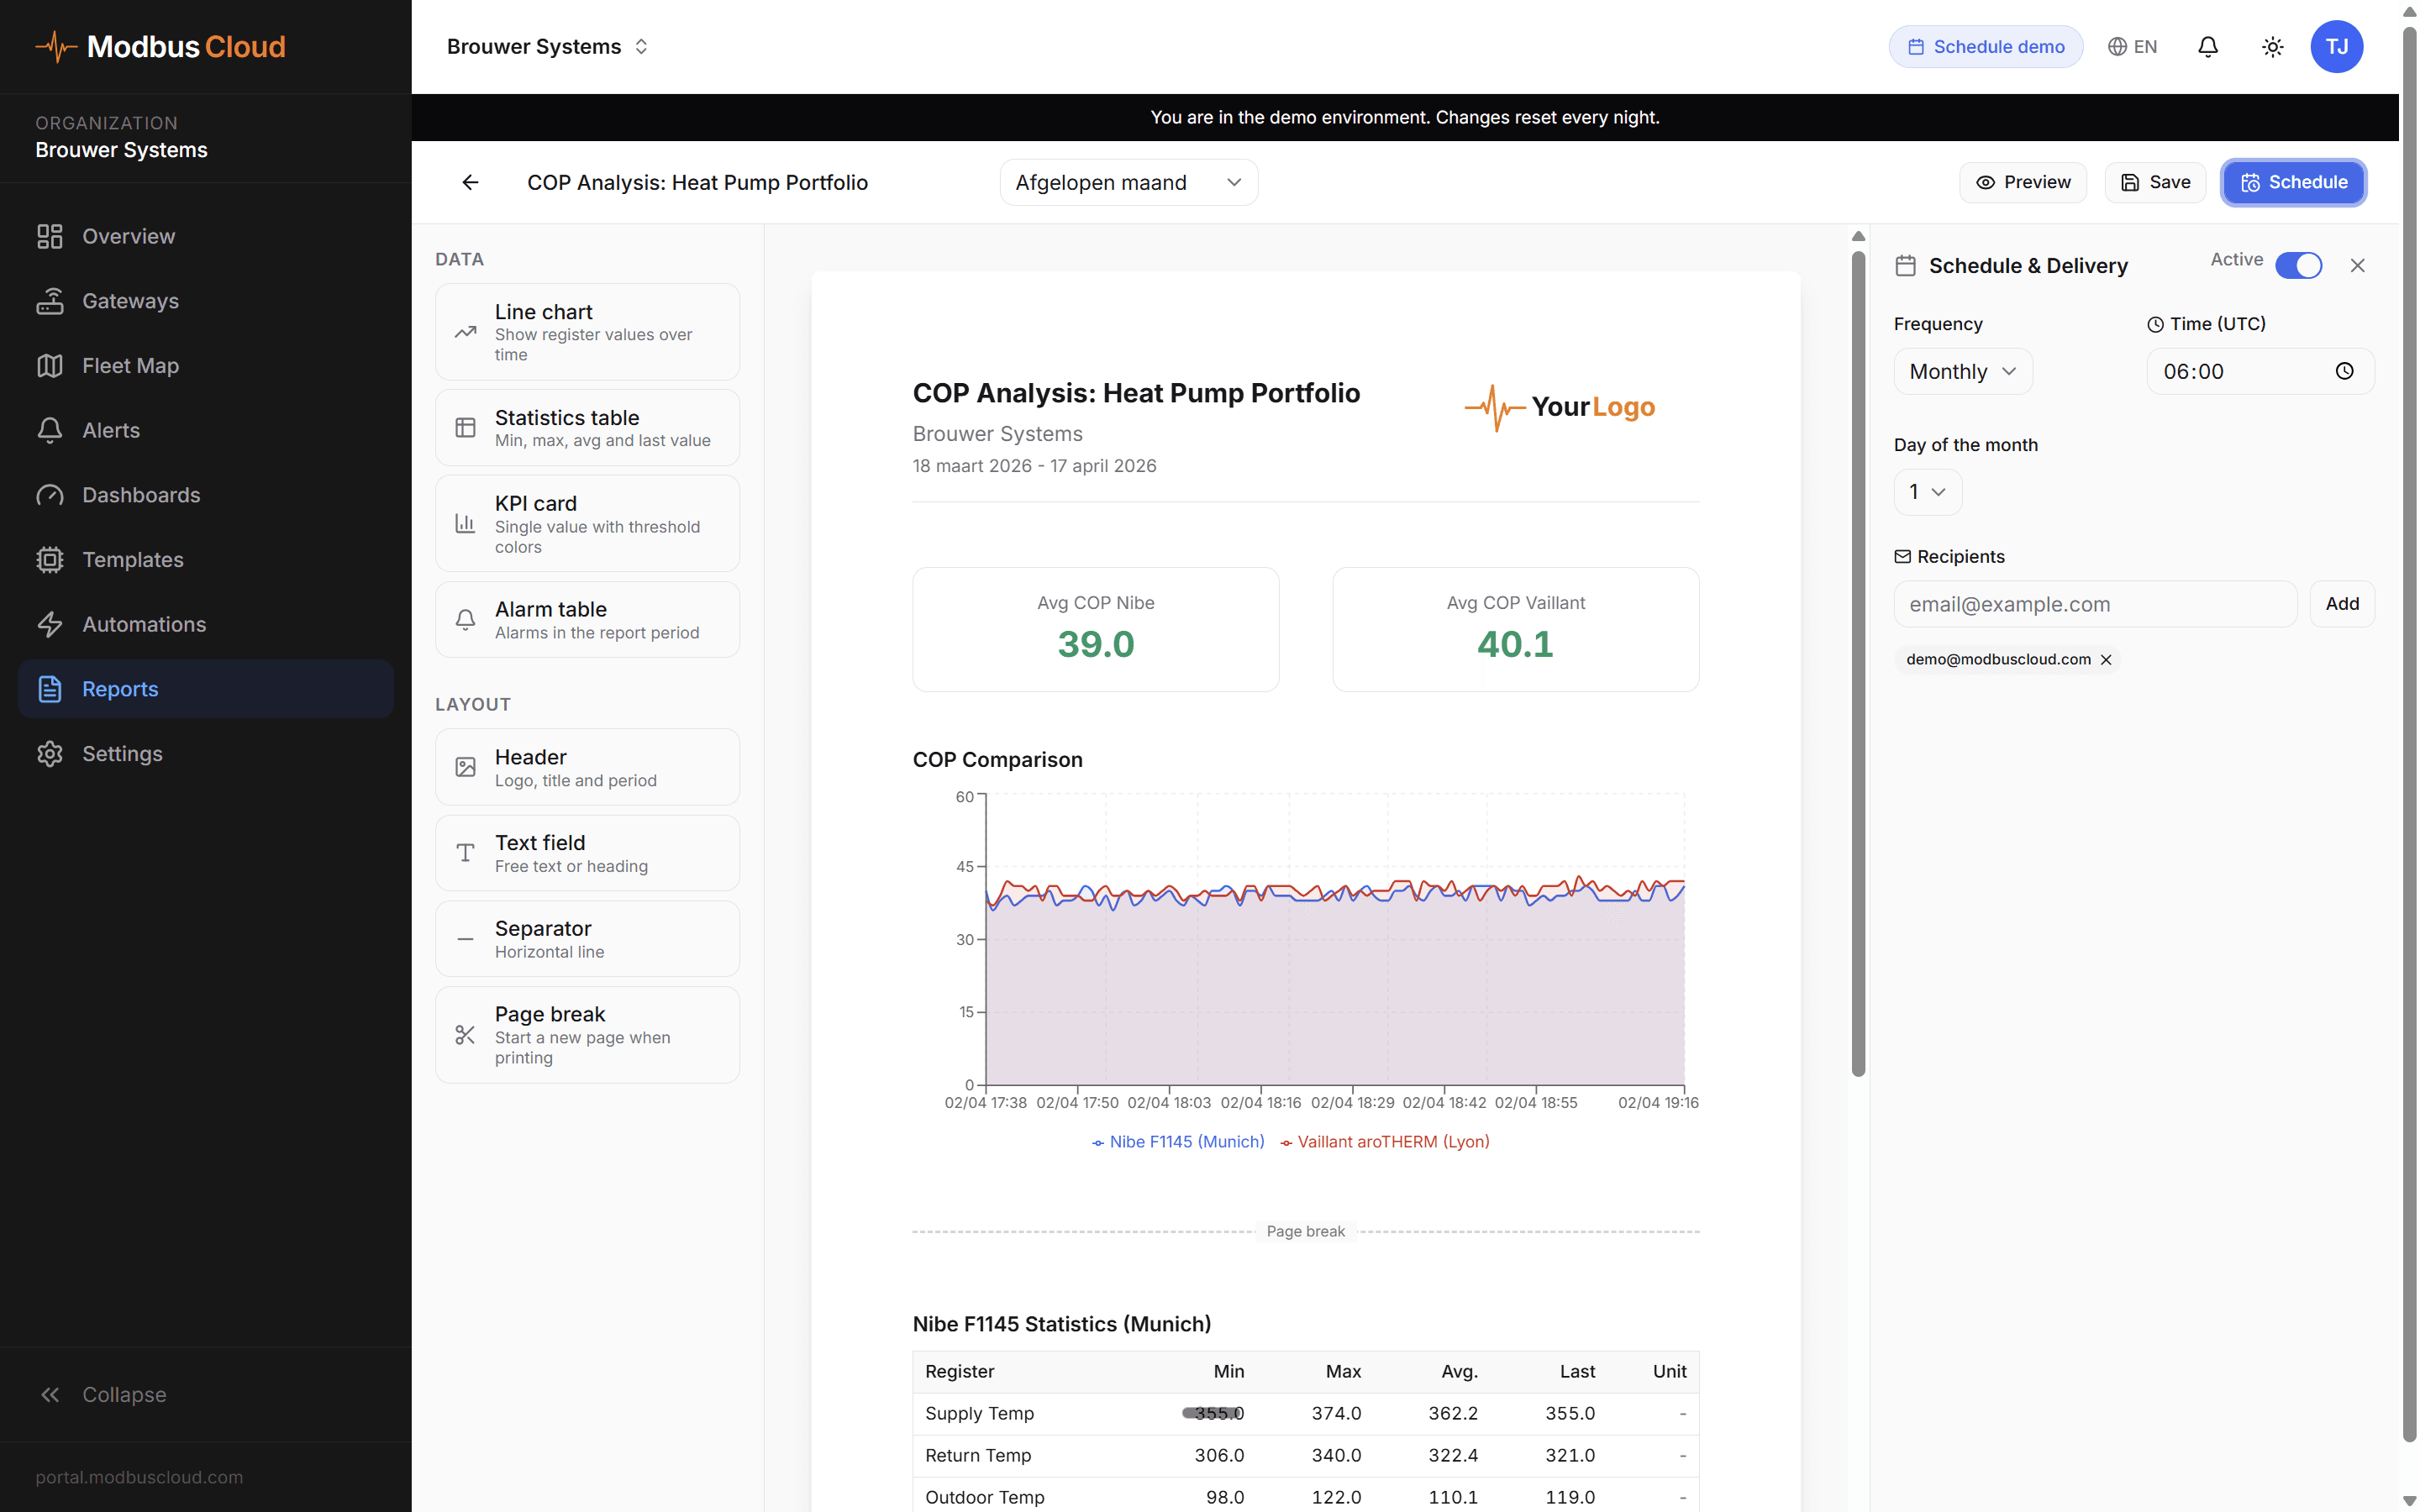
Charts, KPI cards, alarm tables, and free text. What you build on screen, you can export.
Alarm overviews, energy consumption, setpoint history. Exportable as evidence for audits or insurance questions.
The same drag-and-drop as dashboards, with period filters and a schedule around it.
Last 7 days, previous month, quarter, or custom range.
Line chart, statistics, KPI card, alarm table, heading, free text, divider, page break.
For each widget, choose which registers to show.
Export directly as PDF, or let the report run automatically every week or month.
Eight widgets, twelve columns, automated scheduling. Nothing else needed.
From charts to alarm overviews to headings and free text.
The same drag-and-drop as dashboards, same flexibility.
7 days, 30 days, 90 days, this month, last month, custom.
Print friendly stylesheet, ready to email or archive.
Daily, weekly, or monthly. Generated reports are stored automatically.
Build the report once, every month again
PDF export
Per report, per period, per register
Build a template and let the portal do the work. You review, the customer reads.